MVC async cloud (risk) modelling with R OpenCpu and Modern Javascript
Moving from Shiny to R OpenCpu
Two years ago I created a (simple) risk web-application that was implemented with ease and straightforwardness in R Shiny. Despite the easiness of Shiny, I didn't like the mixing of logic (Model) with HTML/JS/CSS (View) in the same R environment. The disadavantages of using Shiny are:
Reusability: Can't reuse the R model (back-end) "as is" in my other applications:
Seperation of concerns and decoupling: Can't tap into the almost unlimited existing Javascript, CSS and HTML frameworks/packages for building the front-end (View).
Scalability and openness: Completely dependent on the Shiny vendor if I wanted to scale the web application to higher levels in terms of speed, scalability and costs.
I've found the MVC (Model-View-Controller) concept as described in my previous blogpost, the most appealing framework to tackle these shortcomings. This article is a practical follow-up of my previous blogpost, where we show the steps to replicate the Shiny webapp by using the MVC modelling framework.
We use the following systems to implement the three layers of the MVC concept:
- Model : R OpenCpu
- View: HTML/CSS
- Controller: Modern Javascript (ES6+)
Model: OpenCpu, the natural scalable computational R backend
OpenCpu, a great API created by Jeroen Ooms, has been built on the following foundations:
- Seperation of concerns: Let R do where it has been built for, namely statistics and graphics.
- Communicate with R from various clients that can speak and understand http.
- Natural scalability: fire multiple asynchroncheous http requests with automatic cloud server scalability
In short, what OpenCpu enables, is creating and retrieving R objects via http(s). For more detailed information on OpenCpu, visit their website.
Setting up Opencpu on any cloud server (Azure/AWS/GC) is super easy: just a matter of copying and pasting few lines of code. However, for this demo we just use the free public server. The nice thing about OpenCpu is that you can automatically hook your github R model "as is" to the (public) server. The R risk model to be used in this demo is already available at github, and hooked to the public server. For more details on the model, see: Model
That is it. We can now call our R model, without any additions or changes, from every client that can speak http!
View: HTML/CSS.
Since we'd like to interact with the model on the web via a dashboard, HTML/CSS would be a natural choice to implement the view. For this, we use the ' Twitter bootstrap ' framework that has a built-in grid system which makes the creation of dashboards a piece of cake. The view, fully written in html/css, looks as follows :
<body>
<div class="d-flex flex-row" id= "first_row">
<div class="p-2" ><select id="selectNumber">
<option>Choose Age</option>
</select>
</div>
<div class="p-2" id ="plot_le"> Wait plotting histogram...</div>
<div class = "p-2" id ="plot_le_time"> </div>
</div>
<div class="d-flex flex-row" id= "second_row" >
<div class = "p-2"></div>
<div class="p-2" >
<pre style = "font-size:70%"> <code id = "table_quantile"> </code></pre>
</div>
<div class="p-2" >
<pre style = "font-size:70%"><code id = "table_le"> </code> </pre>
</div>
</div>
<script src="bundle.js"></script>
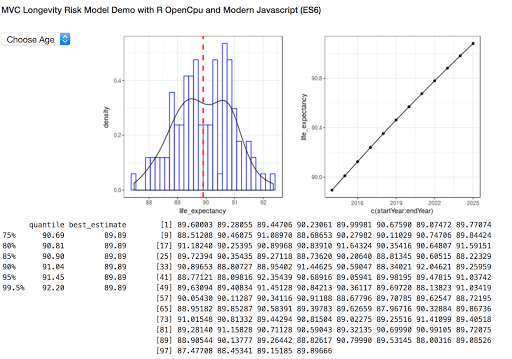
</body>So we've made a dashboard with 2 rows:
First row contains three colums with the following elements:
- Column 1: Option list of 120 age-items
- Column 2: Image container for a histogram
- Column 3: Image container for a plot dispaying the relation between time and life expectancy
Second row contains three columns with the following elements:
- Column 1: Empty
- Column 2: Container for a quantile table
- Column 3: Conatiner for a table displaying life expectancies over time.
The last line as JS script element (bundle.js) where the controller is defined:
Async Controller: Modern Javascript (ES6+)
The controller is where all the magic happens, it's the intermediary between the model and the view. Here we define the control flow that can be triggered by one or multiple events, leading to the creation as well as retrieval of several R nodes/objects. So the R objects are created via the Model, stored on the Server, and displayed/retrieved via the View/Controller .
Get and Create R objects.
Before setting up a control flow, we use the well-known 'Fetch' Javascript module for creating two wrapper functions that retrieve and create asynchronously R resources over the http(s) network:
function form (json){
  return Object.keys(json).map(key=>encodeURIComponent(key)+'='+encodeURIComponent(json[key])).join('&');
};

function createRobject(Rlib, Rfunc, Rparams) {
 return fetch(Rlib + Rfunc, {
    method: 'post',
    headers: {
    'Accept': 'application/json, text/plain, */*',
    'Content-Type': 'application/x-www-form-urlencoded'
  },
    body: form((Rparams))
  })
};

function loadRobject(Location , type) {
   return fetch(Location).then (function (response){ return response.text()});
}
Suppose we want to create 100 random values, generated from the normal distrubiton : rnorm(100). We can achieve this with the createRobject function using the following parameter values:
- Rlib: "stats" . The library of the rnorm function
- Rfunc: "rnorm". The function with which we generate the R object.
- Rparams: {n:100}. The paramer passed to the function.
Execution of the createRobject function generate (R) objects/sessions on the server which can be retrieved for further reuse. Retrieving the R objects can be conducted via the loadRobject function.
Setting up a control flow: using Javascript Generators and Promises
Now we've some JS wrapper functions in place to get and create R objects, let's sum up the control flow we'd like to implement:
- View State. A combox, containing a list of age items, is the starting point of the flow. On change of the combobox, the following flow is triggered:
a) R task,  load a pre-generated stochastic simulation dataset.
b) R task,  calculate stochastic life expectancy for a specific agebased on a)
c) R view state, plot a histogram of life expectancies in R, based on b).
d) R view state,  tabular data of stochastic simulations of life expectancy
e)  R task, calculate quantile and best-estimates of life expectanc based on b)
f) R view state,  tabular data of quantiles and best estimates of life expectancy , based on b)
g) R view state, plot a relationship between time and life expectancy in R, based on b)
The big challenge of implementing the control flow lies in the async nature of http as code-blocks are triggered asynchronously, and it is not known in which order the code-blocks gets finished. A nice javascript library that deals nicely with this issue is the javascript library 'co', which lets you call asynchronous code in a synchrounous way.
The implementation of the workflow with 'co' looks as follows:
function workflow (age){
  co(function *(){

    // initialize views
    document.getElementById('plot_le').innerHTML =  "Please wait, loading graphs ..."
    document.getElementById('plot_le_time').innerHTML =  "Please wait, loading graphs ..."

    // generate the R objects:
    var stochasticSet = yield createRobject(Riskmodel,"loadSimData",{})  ;
    var expectedLife = yield createRobject(Riskmodel,"eex",
                                           {'listQx':stochasticSet.headers.get("X-ocpu-session"),"age":age});
    var rplot_exx = yield createRobject(Riskmodel,"histLifeExpectancy",
                                                   {'eex':expectedLife.headers.get("X-ocpu-session")});
    var rplot_exx_time= yield createRobject(Riskmodel,"drawLifeExpectancyOverTime",
                                                      {'startYear':2014,'endYear':2025,'age':age});
    var rquantile = yield createRobject(Riskmodel,"calculate_quantile",{"stochast":expectedLife.headers.get("X-ocpu-session")});

    // generate the views:
   // histogram
    document.getElementById('plot_le').innerHTML = "<img src ='" + rplot_exx.headers.get("Location")
                                                    +  "/graphics/1/png?height=300&width=300'/>"
    document.getElementById('plot_le_time').innerHTML = "<img src ='" + rplot_exx_time.headers.get("Location")
                                                     +  "/graphics/1/png?height=300&width=300'/>"
    document.getElementById('table_quantile').innerHTML = yield loadRobject(rquantile.headers.get("Location")+"R")
    document.getElementById('table_le').innerHTML =  yield loadRobject(expectedLife.headers.get("Location")+"R/.val")


    }).catch(onerror);

}
End Result
The end result of the MVC webapp can be viewed at :
Screen shot of the app: